Exploring Data
Exploring data forms the core of this book and is also referred to as exploratory data analysis. It involves discovering relationships and patterns as well as developing hypotheses.
What is Exploratory Data Analysis?
Leek and Peng describe exploratory data analysis as a method of "searching for discoveries, trends, correlations, or relationships between the measurements to generate ideas or hypotheses." It does not provide confirmatory results, but instead serves as a springboard for formulating hypotheses that can be tested with subsequent data collection and rigorous statistical methods【6†source】. This characteristic makes EDA both exciting and uncertain: analysts might not know exactly what they will discover, but the exploration process creates the potential for unexpected insights.
The value of EDA lies in its ability to help analysts get a sense of what the data may say before deciding on further analysis techniques. EDA is particularly helpful for identifying outliers, detecting errors, and understanding the underlying data structure, all of which are necessary steps before one can apply more advanced statistical modeling.
Exploratory Data Analysis (EDA) is a vital step in the data analysis process, used to examine and understand datasets through summarization and visualization. This initial exploration helps identify patterns, spot anomalies, and make insights about the data, forming the foundation for hypothesis generation and further statistical analysis. The process aims to ask the data meaningful questions, as highlighted in a paper by Leek and Peng, which emphasizes the importance of distinguishing between various forms of data analyses, such as descriptive, inferential, or predictive analysis, to avoid common pitfalls【6†source】.
The EDA Process

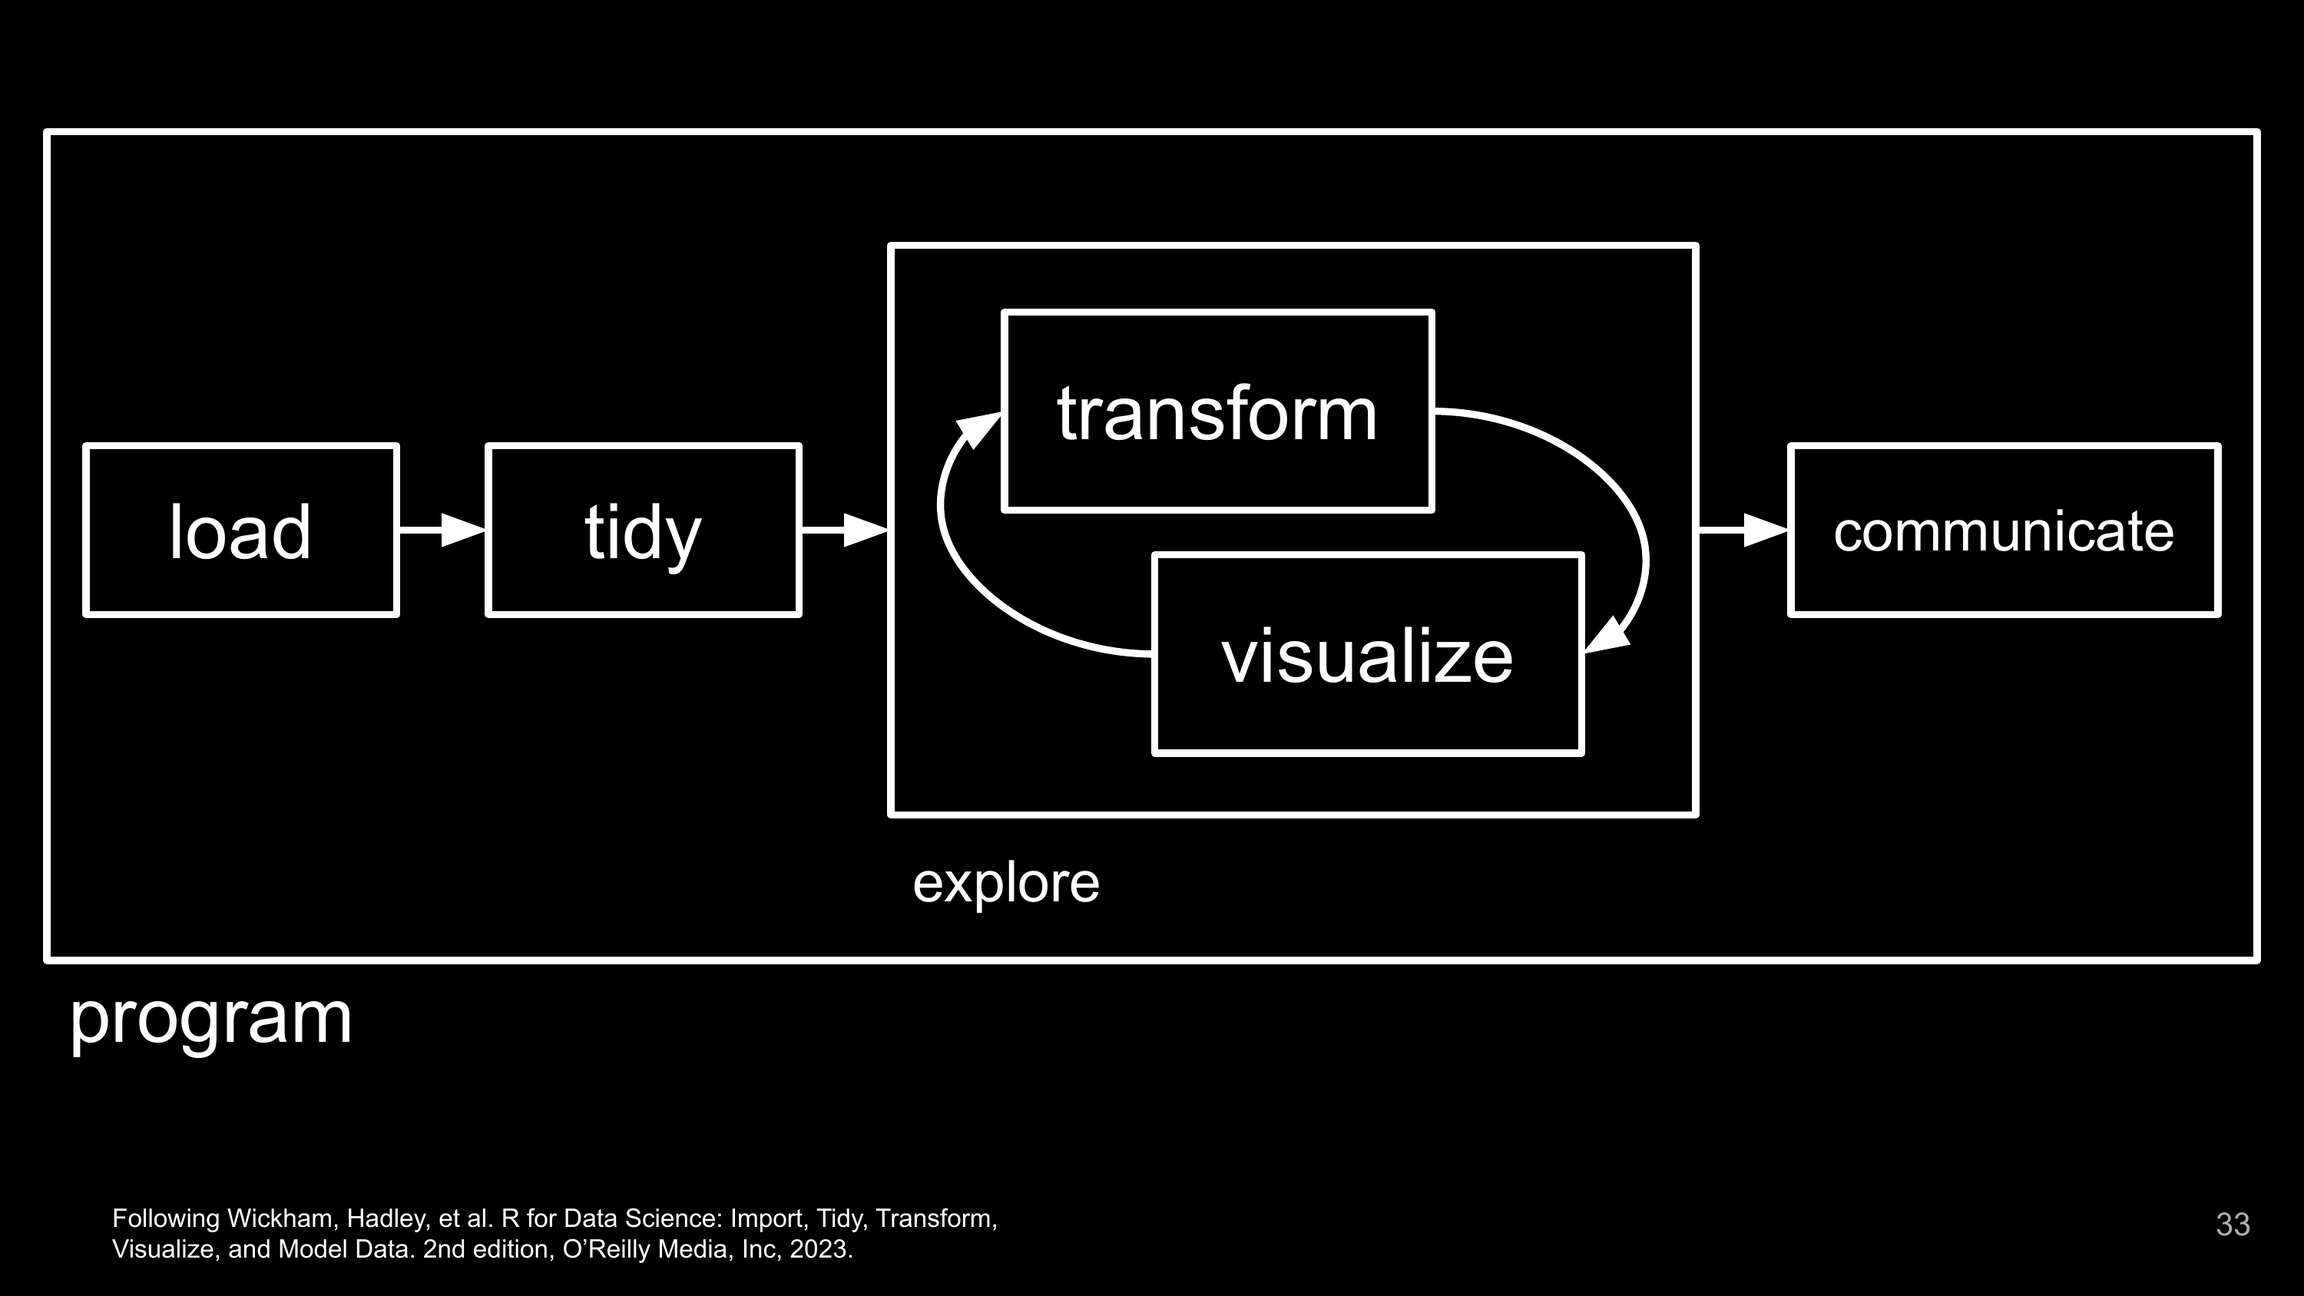
The diagram provided from "R for Data Science" by Hadley Wickham illustrates a structured approach to EDA. The key stages of the process include:
Loading Data: The first step involves gathering data from various sources such as databases, web services, CSV files, or Excel spreadsheets, and preparing it for analysis. It is essential that the data is properly imported and organized into a format that allows efficient exploration and further manipulation.
Tidying Data: This stage ensures that data is structured consistently. In a tidy dataset, each variable is a column, each observation is a row, and each type of observational unit forms a table. This systematic arrangement makes the data more accessible for analysis.
Exploration: Transform and Visualize: This part of the process is the core of exploration and involves both transforming and visualizing the data. The purpose of transforming the data could be to create new variables, normalize scales, summarize and group, or filter specific observations. Visualization helps reveal underlying patterns, correlations, or distributions that are often not obvious in raw tables (see Pleas for data visualization). This exploration stage is crucial for generating hypotheses and gaining insights from the data.
Communicating Findings: Once the exploration reveals meaningful insights, the final step is to communicate these findings. Clear and compelling communication involves summarizing the analyses with appropriate graphs, tables, and narratives to convey the story behind the data effectively to stakeholders. This can be done in various formats, such as a scientific paper, business report, presentation, interactive dashboard, or website. All of this can be achieved with Quartoin RStudio.
The Role of Visualization in EDA
A key component of exploratory data analysis is visualization. During the transform-visualize cycle, visualization is employed to give shape to numbers and relationships. Data visualizations can highlight patterns that are otherwise hidden within spreadsheets (see Pleas for data visualization). For example, scatter plots can show potential correlations, while box plots can indicate the presence of outliers. Visual exploration is not just about aesthetics, but is also a practical tool for data scientists to make informed decisions.
Last updated